图表
限定名称: manim.mobject.graph.Graph
- class Graph(vertices, edges, labels=False, label_fill_color=ManimColor('#000000'), layout='spring', layout_scale=2, layout_config=None, vertex_type=<class 'manim.mobject.geometry.arc.Dot'>, vertex_config=None, vertex_mobjects=None, edge_type=<class 'manim.mobject.geometry.line.Line'>, partitions=None, root_vertex=None, edge_config=None)[source]
基础:
GenericGraph一个无向图(顶点通过边连接)。
该图带有一个更新器,使得边在移动时能够粘附在顶点上。有关带有有向边的版本,请参见
DiGraph。另请参阅
- Parameters:
顶点 (列表[可哈希]) – 顶点列表。必须是可哈希的元素。
edges (list[tuple[Hashable, Hashable]]) – 边的列表,指定为元组
(u, v),其中u和v都是顶点。顶点的顺序无关紧要。labels (bool | dict) – 控制顶点是否被标记。如果为
False(默认值), 顶点不会被标记;如果为True,则使用它们的名称(在vertices中指定)通过MathTex进行标记。另外, 可以通过传递一个字典来指定自定义标签,字典的键是顶点,值是对应的顶点标签 (通过例如文本或Tex渲染)。label_fill_color (str) – 设置当
labels设置为True时生成的默认标签的填充颜色。对于labels的其他值没有影响。布局 (布局名称 | 字典[可哈希, 三维点] | 布局函数) – 可以是以下之一:
"spring"(默认)、"circular"、"kamada_kawai"、"planar"、"random"、"shell"、"spectral"、"spiral"、"tree"和"partite", 用于使用networkx自动定位顶点 (更多详情请参阅 他们的文档), 或者是一个字典,指定每个顶点(键)的坐标(值)用于手动定位。layout_config (dict | None) – 仅用于自动生成的布局。一个字典,其条目作为关键字参数传递给通过
layout指定的自动布局算法。tree布局还接受一个特殊参数vertex_spacing,作为layout_config字典中的关键字参数传递。 传递一个元组(space_x, space_y)作为此参数会覆盖layout_scale的值,并确保顶点以这样的方式排列:同一层中的兄弟节点的中心至少水平相距space_x单位,相邻层垂直相距space_y单位。layout_scale (float | tuple[float, float, float]) – 自动生成布局的比例:顶点将被安排,使得坐标位于区间
[-scale, scale]内。某些布局接受一个元组(scale_x, scale_y),使得第一个坐标位于区间[-scale_x, scale_x],第二个坐标位于[-scale_y, scale_y]。默认值:2。vertex_type (type[Mobject]) – 用于在场景中显示顶点的mobject类。
vertex_config (dict | None) – 可以是一个包含关键字参数的字典,这些参数将传递给通过
vertex_type指定的类,或者是一个字典,其键是顶点,值是与相应顶点相关的mobject的关键字参数字典。vertex_mobjects (dict | None) – 一个字典,其键是顶点,值是用于顶点的mobjects。在此传递顶点将覆盖顶点的所有其他配置选项。
edge_type (type[Mobject]) – 用于在场景中显示边的mobject类。
edge_config (dict | None) – 可以是一个包含关键字参数的字典,这些参数将传递给通过
edge_type指定的类,或者是一个字典,其键是边,值是与相应边相关的mobject的关键字参数。partitions (列表[列表[Hashable]] | 无)
root_vertex (可哈希的 | 无)
示例
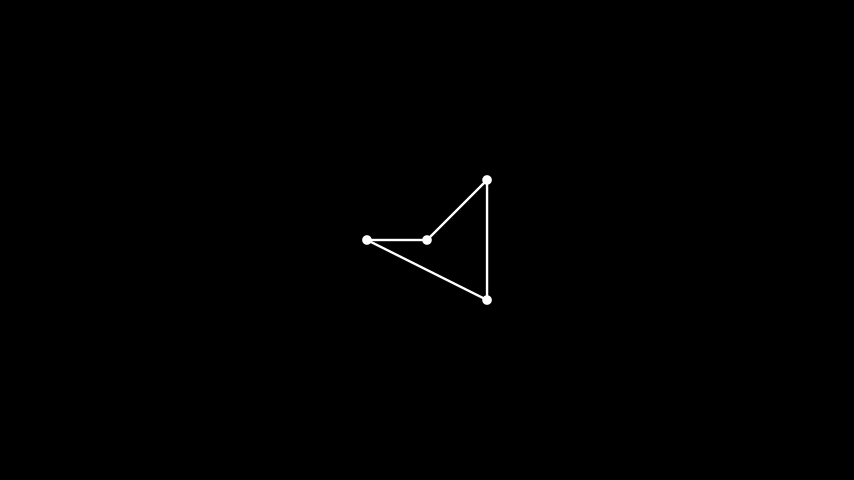
首先,我们创建一个小图并演示边如何与顶点一起移动。
示例:移动顶点 
from manim import *

class MovingVertices(Scene):
    def construct(self):
        vertices = [1, 2, 3, 4]
        edges = [(1, 2), (2, 3), (3, 4), (1, 3), (1, 4)]
        g = Graph(vertices, edges)
        self.play(Create(g))
        self.wait()
        self.play(g[1].animate.move_to([1, 1, 0]),
                  g[2].animate.move_to([-1, 1, 0]),
                  g[3].animate.move_to([1, -1, 0]),
                  g[4].animate.move_to([-1, -1, 0]))
        self.wait()
有几种自动定位算法可供选择:
示例:GraphAutoPosition 

from manim import *

class GraphAutoPosition(Scene):
    def construct(self):
        vertices = [1, 2, 3, 4, 5, 6, 7, 8]
        edges = [(1, 7), (1, 8), (2, 3), (2, 4), (2, 5),
                 (2, 8), (3, 4), (6, 1), (6, 2),
                 (6, 3), (7, 2), (7, 4)]
        autolayouts = ["spring", "circular", "kamada_kawai",
                       "planar", "random", "shell",
                       "spectral", "spiral"]
        graphs = [Graph(vertices, edges, layout=lt).scale(0.5)
                  for lt in autolayouts]
        r1 = VGroup(*graphs[:3]).arrange()
        r2 = VGroup(*graphs[3:6]).arrange()
        r3 = VGroup(*graphs[6:]).arrange()
        self.add(VGroup(r1, r2, r3).arrange(direction=DOWN))
顶点也可以手动定位:
示例:GraphManualPosition 
from manim import *

class GraphManualPosition(Scene):
    def construct(self):
        vertices = [1, 2, 3, 4]
        edges = [(1, 2), (2, 3), (3, 4), (4, 1)]
        lt = {1: [0, 0, 0], 2: [1, 1, 0], 3: [1, -1, 0], 4: [-1, 0, 0]}
        G = Graph(vertices, edges, layout=lt)
        self.add(G)
class GraphManualPosition(Scene):
    def construct(self):
        vertices = [1, 2, 3, 4]
        edges = [(1, 2), (2, 3), (3, 4), (4, 1)]
        lt = {1: [0, 0, 0], 2: [1, 1, 0], 3: [1, -1, 0], 4: [-1, 0, 0]}
        G = Graph(vertices, edges, layout=lt)
        self.add(G)
图中的顶点可以被标记,顶点和边的配置可以通过默认设置以及针对特定顶点和边进行修改。
注意
在
edge_config中,边可以双向传递:如果(u, v)是图中的一条边,那么(u, v)以及(v, u)都可以用作字典中的键。示例:LabeledModifiedGraph 
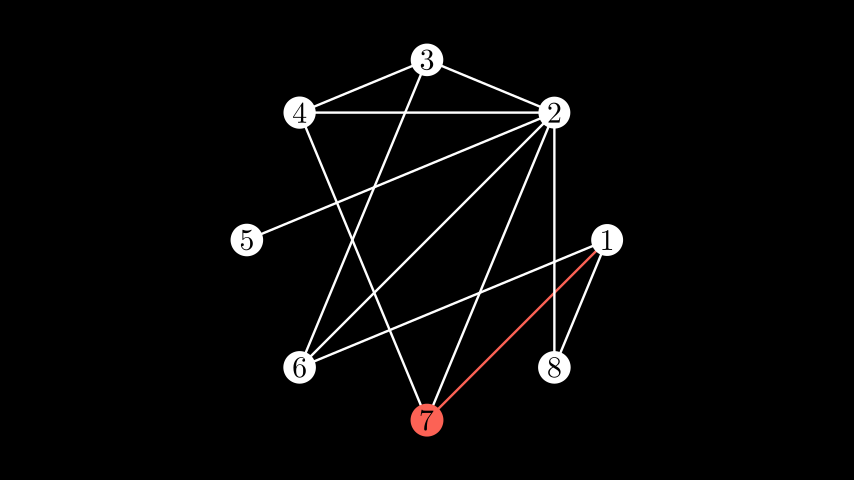
from manim import *

class LabeledModifiedGraph(Scene):
    def construct(self):
        vertices = [1, 2, 3, 4, 5, 6, 7, 8]
        edges = [(1, 7), (1, 8), (2, 3), (2, 4), (2, 5),
                 (2, 8), (3, 4), (6, 1), (6, 2),
                 (6, 3), (7, 2), (7, 4)]
        g = Graph(vertices, edges, layout="circular", layout_scale=3,
                  labels=True, vertex_config={7: {"fill_color": RED}},
                  edge_config={(1, 7): {"stroke_color": RED},
                               (2, 7): {"stroke_color": RED},
                               (4, 7): {"stroke_color": RED}})
        self.add(g)
您还可以通过指定每侧的顶点列表并选择分块布局来在列上布局分块图。
注意
图中未列在任何分区中的所有顶点将被收集到它们自己的分区中,并在最右侧的列中呈现。
示例:PartiteGraph 

from manim import *

import networkx as nx

class PartiteGraph(Scene):
    def construct(self):
        G = nx.Graph()
        G.add_nodes_from([0, 1, 2, 3])
        G.add_edges_from([(0, 2), (0,3), (1, 2)])
        graph = Graph(list(G.nodes), list(G.edges), layout="partite", partitions=[[0, 1]])
        self.play(Create(graph))
通过使用分层布局并为每一层定义分区,可以方便地表示线性人工神经网络。
示例:LinearNN 

from manim import *

class LinearNN(Scene):
    def construct(self):
        edges = []
        partitions = []
        c = 0
        layers = [2, 3, 3, 2]  # the number of neurons in each layer

        for i in layers:
            partitions.append(list(range(c + 1, c + i + 1)))
            c += i
        for i, v in enumerate(layers[1:]):
                last = sum(layers[:i+1])
                for j in range(v):
                    for k in range(last - layers[i], last):
                        edges.append((k + 1, j + last + 1))

        vertices = np.arange(1, sum(layers) + 1)

        graph = Graph(
            vertices,
            edges,
            layout='partite',
            partitions=partitions,
            layout_scale=3,
            vertex_config={'radius': 0.20},
        )
        self.add(graph)
自定义树布局可用于显示从根顶点开始的图。您必须传递树的根顶点。
示例:树 
from manim import *

import networkx as nx

class Tree(Scene):
    def construct(self):
        G = nx.Graph()

        G.add_node("ROOT")

        for i in range(5):
            G.add_node("Child_%i" % i)
            G.add_node("Grandchild_%i" % i)
            G.add_node("Greatgrandchild_%i" % i)

            G.add_edge("ROOT", "Child_%i" % i)
            G.add_edge("Child_%i" % i, "Grandchild_%i" % i)
            G.add_edge("Grandchild_%i" % i, "Greatgrandchild_%i" % i)

        self.play(Create(
            Graph(list(G.nodes), list(G.edges), layout="tree", root_vertex="ROOT")))
以下代码示例展示了特定于
"tree"布局的vertex_spacing布局参数的使用。如上所述,设置vertex_spacing会覆盖layout_scale的指定值,因此更难控制mobject的大小。然而,我们可以通过使用MovingCameraScene来调整捕获的帧并缩小视图:class LargeTreeGeneration(MovingCameraScene): DEPTH = 4 CHILDREN_PER_VERTEX = 3 LAYOUT_CONFIG = {"vertex_spacing": (0.5, 1)} VERTEX_CONF = {"radius": 0.25, "color": BLUE_B, "fill_opacity": 1} def expand_vertex(self, g, vertex_id: str, depth: int): new_vertices = [f"{vertex_id}/{i}" for i in range(self.CHILDREN_PER_VERTEX)] new_edges = [(vertex_id, child_id) for child_id in new_vertices] g.add_edges( *new_edges, vertex_config=self.VERTEX_CONF, positions={ k: g.vertices[vertex_id].get_center() + 0.1 * DOWN for k in new_vertices }, ) if depth < self.DEPTH: for child_id in new_vertices: self.expand_vertex(g, child_id, depth + 1) return g def construct(self): g = Graph(["ROOT"], [], vertex_config=self.VERTEX_CONF) g = self.expand_vertex(g, "ROOT", 1) self.add(g) self.play( g.animate.change_layout( "tree", root_vertex="ROOT", layout_config=self.LAYOUT_CONFIG, ) ) self.play(self.camera.auto_zoom(g, margin=1), run_time=0.5)
方法
update_edges属性
animate用于动画化
self的任何方法的应用。animation_overridescolordepthmobject的深度。
fill_color如果有多种颜色(用于渐变),则返回第一个颜色
heightmobject的高度。
n_points_per_curvesheen_factorstroke_colorwidthmobject的宽度。
- _original__init__(vertices, edges, labels=False, label_fill_color=ManimColor('#000000'), layout='spring', layout_scale=2, layout_config=None, vertex_type=<class 'manim.mobject.geometry.arc.Dot'>, vertex_config=None, vertex_mobjects=None, edge_type=<class 'manim.mobject.geometry.line.Line'>, partitions=None, root_vertex=None, edge_config=None)
初始化自身。有关准确的签名,请参阅 help(type(self))。
- Parameters:
顶点 (列表[可哈希])
edges (列表[元组[Hashable, Hashable]])
标签 (布尔 | 字典)
label_fill_color (str)
布局 (字面量['circular', 'kamada_kawai', 'partite', 'planar', 'random', 'shell', 'spectral', 'spiral', 'spring', 'tree'] | 字典[~typing.Hashable, ~manim.typing.Point3D] | ~manim.mobject.graph.LayoutFunction)
layout_scale (float | tuple[float, float, float])
layout_config (dict | None)
vertex_type (类型[Mobject])
vertex_config (字典 | 无)
vertex_mobjects (字典 | 无)
edge_type (类型[Mobject])
partitions (列表[列表[Hashable]] | 无)
root_vertex (可哈希的 | 无)
edge_config (dict | None)
- Return type:
无