坐标轴
限定名称: manim.mobject.graphing.coordinate\_systems.Axes
- class Axes(x_range=None, y_range=None, x_length=12, y_length=6, axis_config=None, x_axis_config=None, y_axis_config=None, tips=True, **kwargs)[source]
基础类:
VGroup,CoordinateSystem创建一组坐标轴。
- Parameters:
x_range (Sequence[float] | None) – x轴的
(x_min, x_max, x_step)值。y_range (Sequence[float] | None) – y轴的
(y_min, y_max, y_step)值。x_length (float | None) – x轴的长度。
y_length (float | None) – y轴的长度。
axis_config (dict | None) – 传递给
NumberLine的参数,影响两个轴。x_axis_config (dict | None) – 传递给
NumberLine的参数,用于影响x轴。y_axis_config (dict | None) – 传递给
NumberLine的参数,用于影响y轴。提示 (布尔值) – 是否在两条轴上包含提示。
kwargs (Any) – 传递给
CoordinateSystem和VGroup的额外参数。
示例
示例:LogScalingExample 

from manim import *

class LogScalingExample(Scene):
    def construct(self):
        ax = Axes(
            x_range=[0, 10, 1],
            y_range=[-2, 6, 1],
            tips=False,
            axis_config={"include_numbers": True},
            y_axis_config={"scaling": LogBase(custom_labels=True)},
        )

        # x_min must be > 0 because log is undefined at 0.
        graph = ax.plot(lambda x: x ** 2, x_range=[0.001, 10], use_smoothing=False)
        self.add(ax, graph)
样式参数可以传递给表示坐标轴的基础
NumberLinemobjects:示例:不同提示的轴 
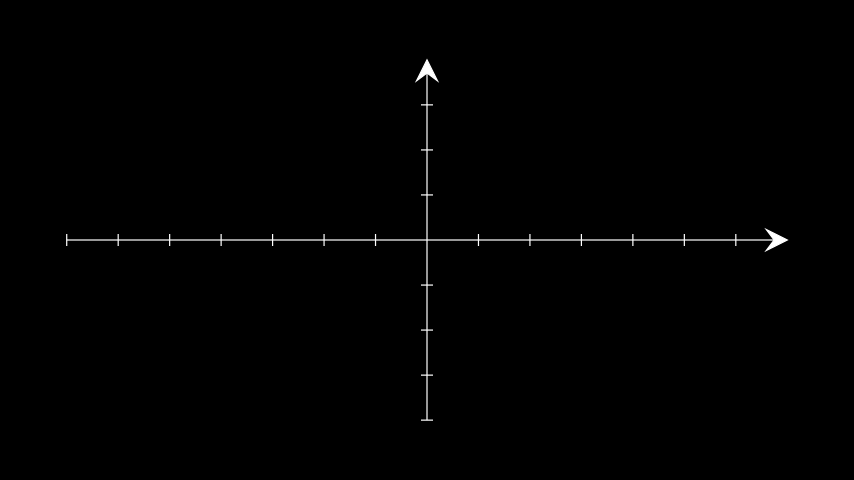
from manim import *

class AxesWithDifferentTips(Scene):
    def construct(self):
        ax = Axes(axis_config={'tip_shape': StealthTip})
        self.add(ax)
class AxesWithDifferentTips(Scene):
    def construct(self):
        ax = Axes(axis_config={'tip_shape': StealthTip})
        self.add(ax)
方法
接受来自坐标轴的坐标,并返回相对于场景的点。
获取坐标轴。
定义图表的x轴和y轴的标签。
绘制一条折线图。
接受场景中的一个点并返回其相对于轴的坐标。
属性
animate用于动画化
self的任何方法的应用。animation_overridescolordepthmobject的深度。
fill_color如果有多种颜色(用于渐变),则返回第一个颜色
heightmobject的高度。
n_points_per_curvesheen_factorstroke_colorwidthmobject的宽度。
- _create_axis(range_terms, axis_config, length)[source]
创建一个轴,并根据0在直线上的位置动态调整其位置。
- Parameters:
range_terms (Sequence[float]) – 轴的范围:
(x_min, x_max, x_step)。axis_config (dict[str, Any]) – 传递给
NumberLine的额外参数。length (float) – 轴的长度。
- Returns:
返回基于
range_terms的数字线。- Return type:
NumberLine
- static _origin_shift(axis_range)[来源]
确定当0不在轴上时如何移动图形对象以进行补偿。
- Parameters:
axis_range (Sequence[float]) – 轴的范围:
(x_min, x_max, x_step)。- Return type:
浮点数
- _original__init__(x_range=None, y_range=None, x_length=12, y_length=6, axis_config=None, x_axis_config=None, y_axis_config=None, tips=True, **kwargs)
初始化自身。有关准确的签名,请参阅 help(type(self))。
- Parameters:
x_range (序列[浮点数] | 无)
y_range (序列[浮点数] | 无)
x_length (float | None)
y_length (float | None)
axis_config (dict | None)
x_axis_config (字典 | 无)
y_axis_config (dict | None)
提示 (布尔值)
kwargs (任意)
- Return type:
无
- static _update_default_configs(default_configs, passed_configs)[source]
接收两个字典元组并返回修改后的第一个元组,使得
passed_configs中的值覆盖default_configs中的值。如果某个键在default_configs中不存在,则将其添加到字典中。此方法对于在类中设置默认值并能够用用户定义的输入覆盖它们非常有用。
- Parameters:
default_configs (tuple[dict[Any, Any]]) – 将被更新的字典。
passed_configs (tuple[dict[Any, Any]]) – 将用于更新的字典。
- Return type:
无
示例
要创建一个包含一个字典的元组,请在元素后添加逗号:
self._update_default_configs(
    (dict_1,)(
        dict_2,
    )
)
- coords_to_point(*coords)[来源]
接受来自坐标轴的坐标,并返回相对于场景的点。
- Parameters:
coords (float | Sequence[float] | Sequence[Sequence[float]] | ndarray) –
坐标。每个坐标作为单独的参数传递:
ax.coords_to_point(1, 2, 3)。也接受坐标列表
ax.coords_to_point( [x_0, x_1, ...], [y_0, y_1, ...], ... )ax.coords_to_point( [[x_0, y_0, z_0], [x_1, y_1, z_1]] )- Returns:
一个相对于场景坐标系的点。 数组的形状将与输入的形状相似。
- Return type:
np.ndarray
示例
>>> from manim import Axes
>>> import numpy as np
>>> ax = Axes()
>>> np.around(ax.coords_to_point(1, 0, 0), 2)
array([0.86, 0.  , 0.  ])
>>> np.around(ax.coords_to_point([[0, 1], [1, 1], [1, 0]]), 2)
array([[0.  , 0.75, 0.  ],
       [0.86, 0.75, 0.  ],
       [0.86, 0.  , 0.  ]])
>>> np.around(
...     ax.coords_to_point([0, 1, 1], [1, 1, 0]), 2
... )  # Transposed version of the above
array([[0.  , 0.86, 0.86],
       [0.75, 0.75, 0.  ],
       [0.  , 0.  , 0.  ]])
示例:CoordsToPointExample 
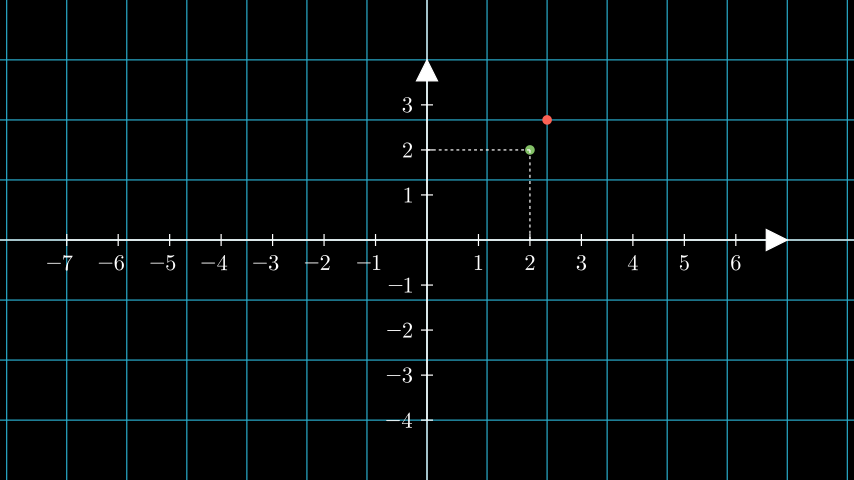
from manim import *

class CoordsToPointExample(Scene):
    def construct(self):
        ax = Axes().add_coordinates()

        # a dot with respect to the axes
        dot_axes = Dot(ax.coords_to_point(2, 2), color=GREEN)
        lines = ax.get_lines_to_point(ax.c2p(2,2))

        # a dot with respect to the scene
        # the default plane corresponds to the coordinates of the scene.
        plane = NumberPlane()
        dot_scene = Dot((2,2,0), color=RED)

        self.add(plane, dot_scene, ax, dot_axes, lines)
- get_axis_labels(x_label='x', y_label='y')[来源]
定义图表的x轴和y轴的标签。
为了增加对标签位置的控制,使用
get_x_axis_label()和get_y_axis_label()。- Parameters:
- Returns:
一个
VGroup,用于x轴和y轴的标签。- Return type:
示例
示例:GetAxisLabelsExample 
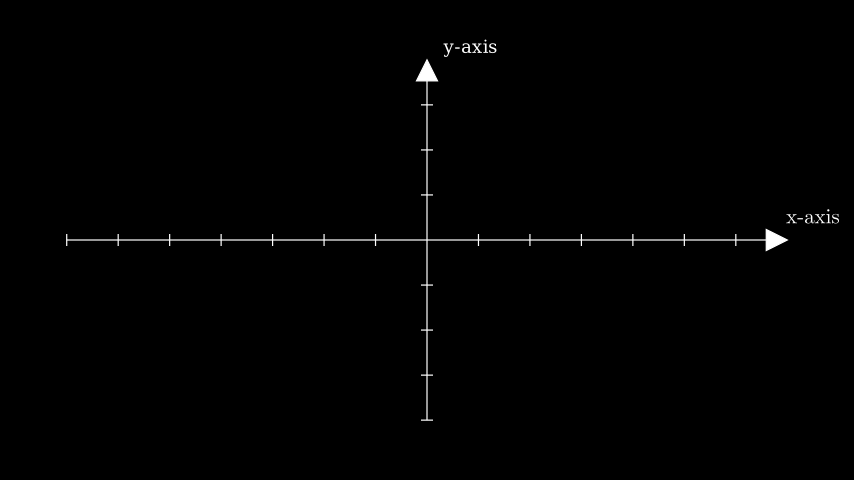
from manim import *

class GetAxisLabelsExample(Scene):
    def construct(self):
        ax = Axes()
        labels = ax.get_axis_labels(
            Tex("x-axis").scale(0.7), Text("y-axis").scale(0.45)
        )
        self.add(ax, labels)
class GetAxisLabelsExample(Scene):
    def construct(self):
        ax = Axes()
        labels = ax.get_axis_labels(
            Tex("x-axis").scale(0.7), Text("y-axis").scale(0.45)
        )
        self.add(ax, labels)
- plot_line_graph(x_values, y_values, z_values=None, line_color=ManimColor('#FFFF00'), add_vertex_dots=True, vertex_dot_radius=0.08, vertex_dot_style=None, **kwargs)[source]
绘制一条折线图。
该图连接了由
x_values、y_values和z_values压缩形成的顶点。如果add_vertex_dots设置为True,还会在顶点处添加Dots。- Parameters:
x_values (Iterable[float]) – 沿x轴的值的可迭代对象。
y_values (Iterable[float]) – 沿y轴的值的可迭代对象。
z_values (Iterable[float] | None) – 沿z轴的值(如果z_values为None,则为零)的可迭代对象。
line_color (ParsableManimColor) – 折线图的颜色。
add_vertex_dots (bool) – 是否在每个顶点添加
Dot。vertex_dot_radius (float) – 每个顶点处
Dot的半径。vertex_dot_style (dict[str, Any] | None) – 传递给每个顶点的
Dot的样式参数。kwargs (Any) – 传递给
VMobject的额外参数。
- Returns:
一个包含线条和点(如果指定)的VDict。可以通过以下方式访问线条:
line_graph["line_graph"]。 可以通过以下方式访问点:line_graph["vertex_dots"]。- Return type:
示例
示例:LineGraphExample 
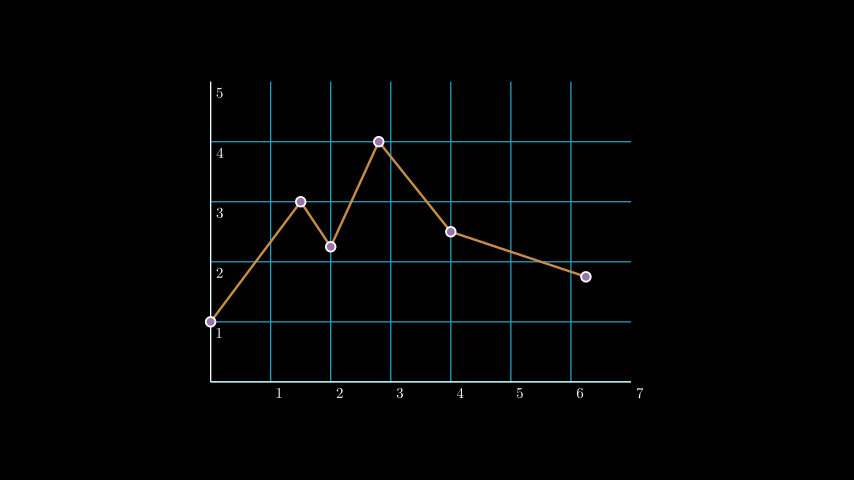
from manim import *

class LineGraphExample(Scene):
    def construct(self):
        plane = NumberPlane(
            x_range = (0, 7),
            y_range = (0, 5),
            x_length = 7,
            axis_config={"include_numbers": True},
        )
        plane.center()
        line_graph = plane.plot_line_graph(
            x_values = [0, 1.5, 2, 2.8, 4, 6.25],
            y_values = [1, 3, 2.25, 4, 2.5, 1.75],
            line_color=GOLD_E,
            vertex_dot_style=dict(stroke_width=3,  fill_color=PURPLE),
            stroke_width = 4,
        )
        self.add(plane, line_graph)
- point_to_coords(point)[source]
接受场景中的一个点并返回其相对于轴的坐标。
- Parameters:
点 (序列[浮点数]) – 点,即
RIGHT或[0, 1, 0]。 也接受点列表,如[RIGHT, [0, 1, 0]]。- Returns:
轴上的坐标,即
[4.0, 7.0]。如果 point 是点的列表,则返回坐标的列表。- Return type:
np.ndarray[float]
示例
>>> from manim import Axes, RIGHT
>>> import numpy as np
>>> ax = Axes(x_range=[0, 10, 2])
>>> np.around(ax.point_to_coords(RIGHT), 2)
array([5.83, 0.  ])
>>> np.around(ax.point_to_coords([[0, 0, 1], [1, 0, 0]]), 2)
array([[5.  , 0.  ],
       [5.83, 0.  ]])
示例:PointToCoordsExample 

from manim import *

class PointToCoordsExample(Scene):
    def construct(self):
        ax = Axes(x_range=[0, 10, 2]).add_coordinates()
        circ = Circle(radius=0.5).shift(UR * 2)

        # get the coordinates of the circle with respect to the axes
        coords = np.around(ax.point_to_coords(circ.get_right()), decimals=2)

        label = (
            Matrix([[coords[0]], [coords[1]]]).scale(0.75).next_to(circ, RIGHT)
        )

        self.add(ax, circ, label, Dot(circ.get_right()))